Last modified: 5 December 2010
The earthquake forecast testing experiment for the Japan area conducted within the framework of the Collaboratory for the Study of Earthquake Predictability (CSEP) is of a 2-dimensional (2D) sort. To make full use of Japan, one of the most seismically active and well-instrumented regions in the world, as a natural laboratory, we try to better understand how rules and a research environment for a 3D experiment can be set up by modifying the original 2D experiment in Japan. The performance of every participating forecast model is assessed by a check against earthquakes that occur in a 3-dimensional space. The trial for setting up a research environment for 3D earthquake forecasting testing turns out to be the first occasion in the world. We offer greater Kanto as a test case. If you need further information, please contact at ZISINyosoku-submit@eri.u-tokyo.ac.jp.
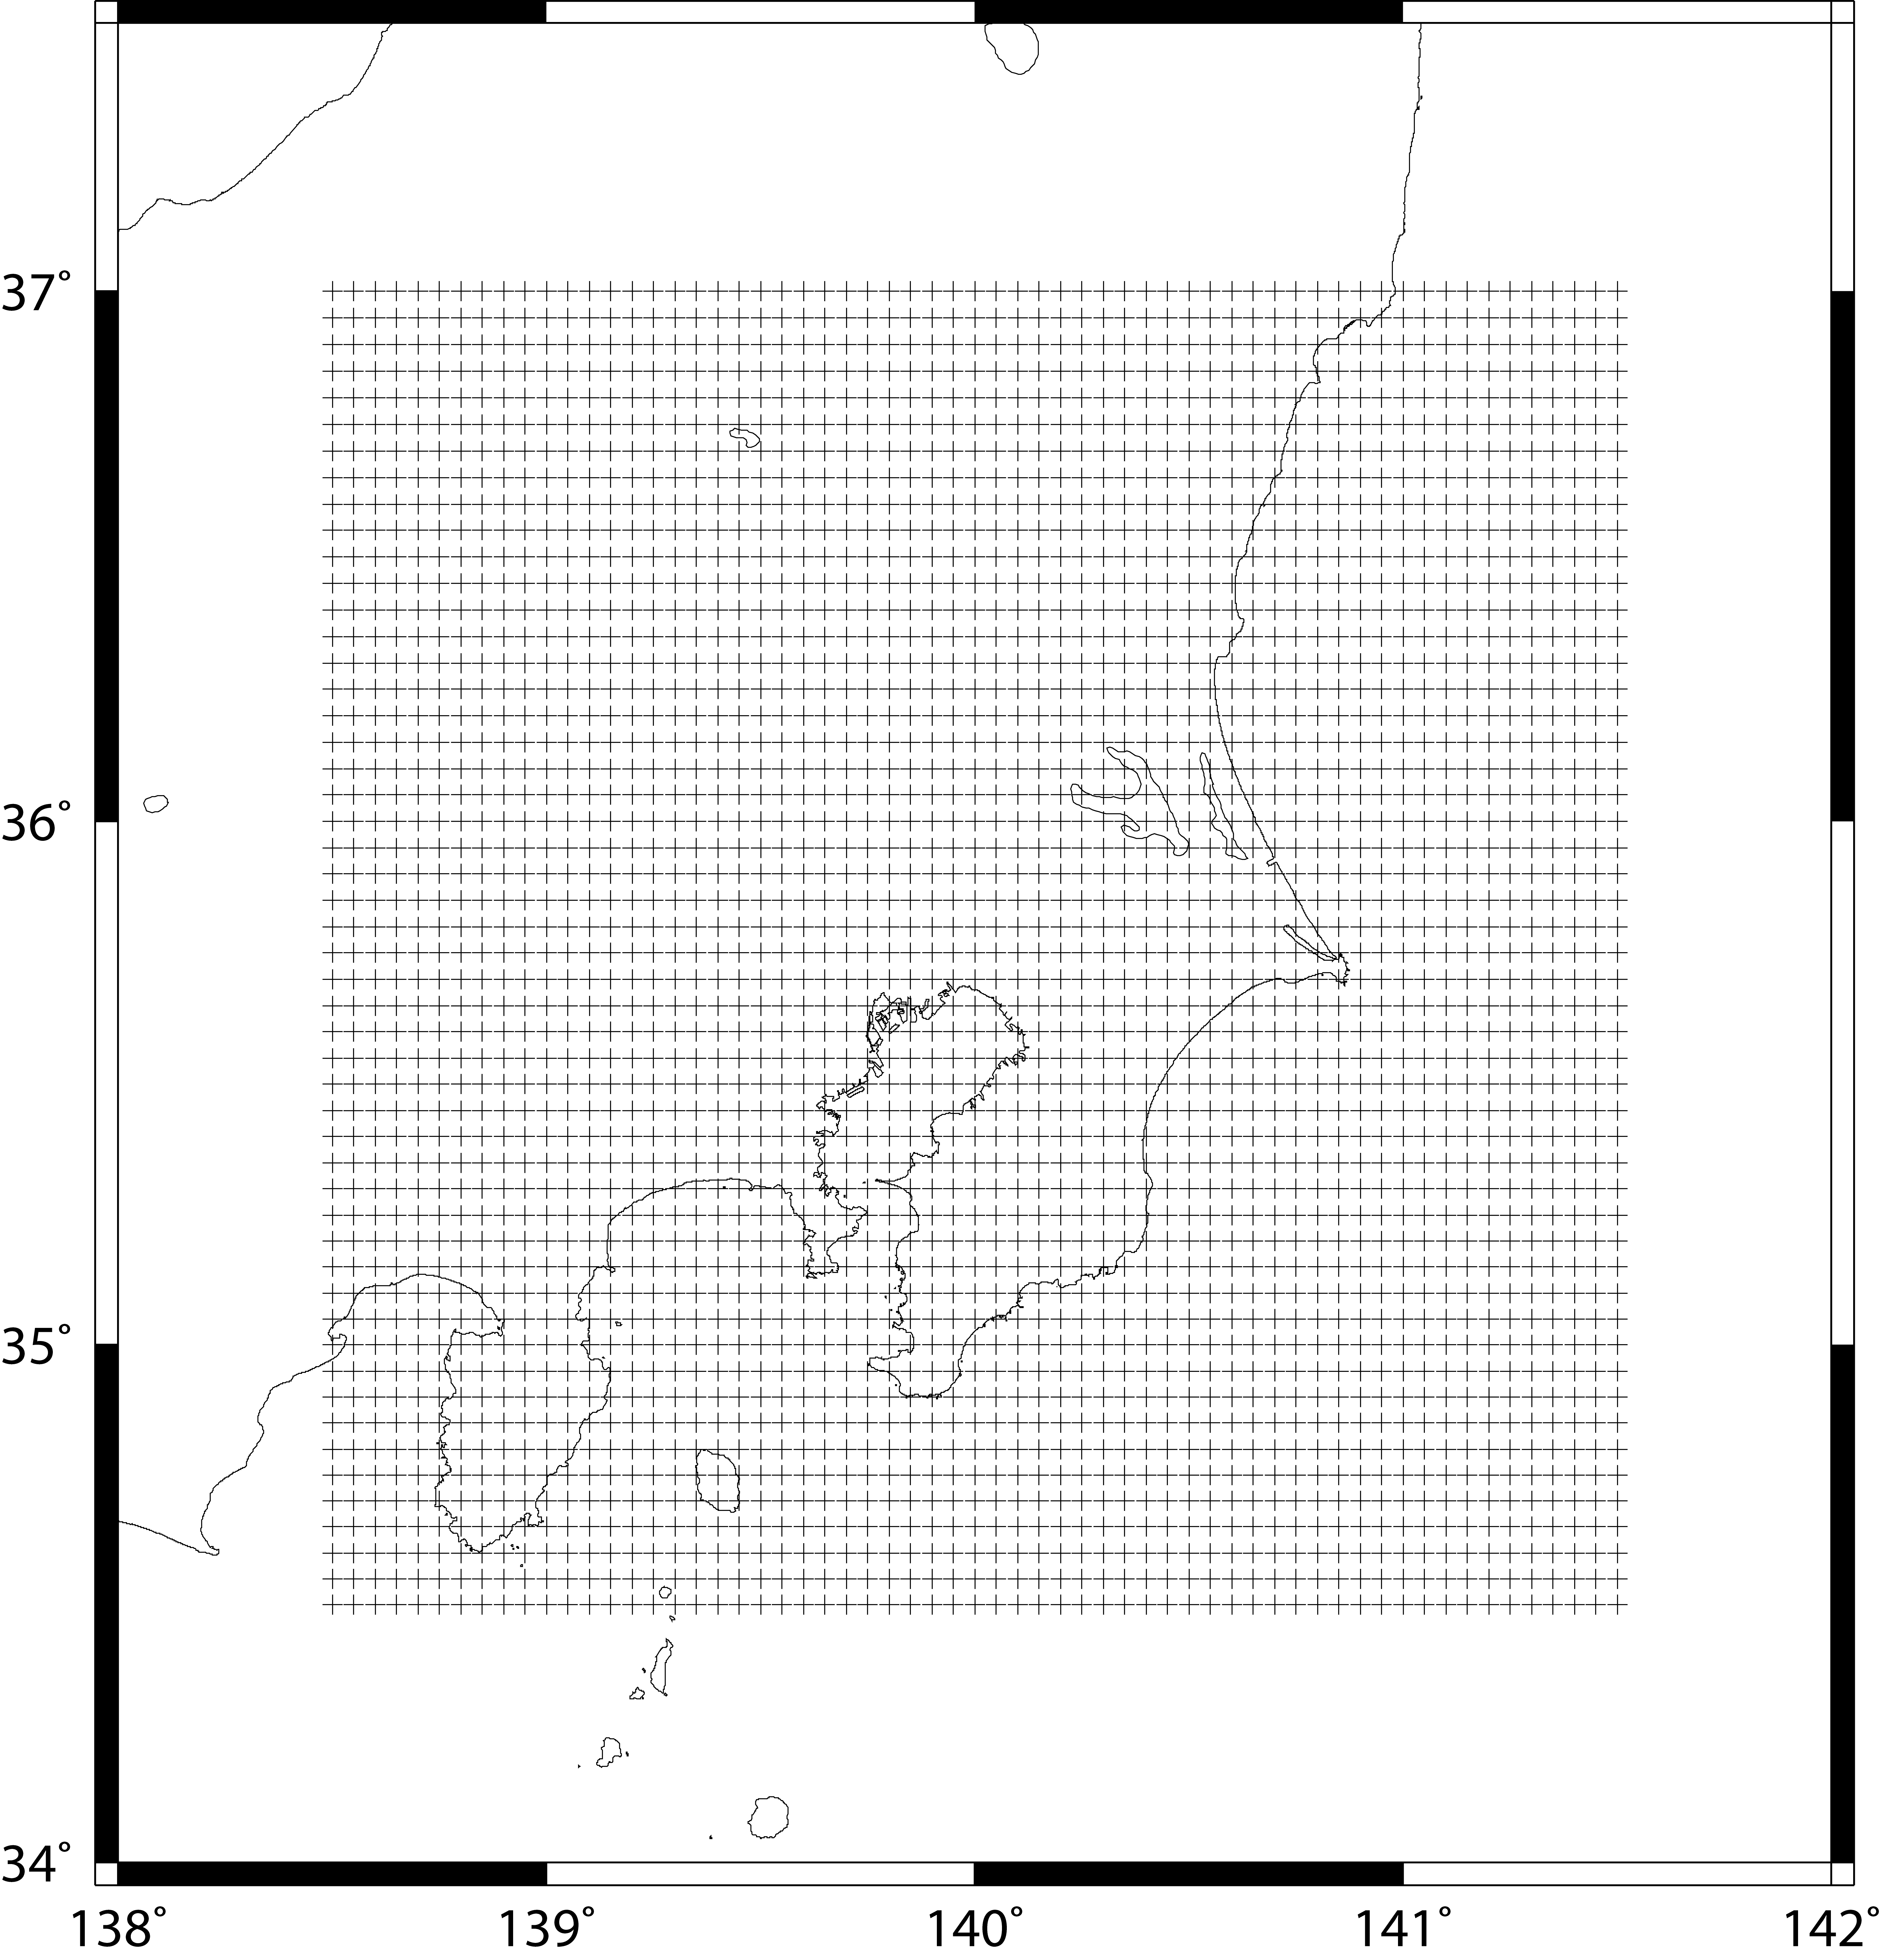
The testing region "Kanto 3D" covers greater Kanto for a depth range d <= 100 km. The region consists of 62220 nodes (longitude-latitude-depth triplets), with a node spacing of 0.05° in longitude and latitude and 5 km in depth, each node at which forecast numbers of events for a predefined magnitude range are computed. The longitude-latitude pairs of the testing region "Kanto" in Fig.1 (png, pdf, eps) are used for the "Kanto 3D" region. For the "Kanto 3D", we consider 20 depths: 2.5, 7.5, 12.5, ..., 97.5 (km). For example, the node (138.50, 34.50, 2.5) in (longitude [°], latitude [°], depth [km]) represents the center of the box with the 8 edges: (138.475, 34.525, 0.0), (138.525, 34.525, 0.0), (138.525, 34.475, 0.0), (138.475, 34.475, 0.0), (138.475, 34.525, 5.0), (138.525, 34.525, 5.0), (138.525, 34.475, 5.0), and (138.475, 34.475, 5.0). The file of the node list for the "Kanto 3D" is given in the section "GridML and ForecastML template".
To be determined. To conduct test runs, modelers are encouraged to apply their model(s) to one or more of the testing classes that are currently used for the CSEP testing experiment in Japan. The current classes include
Modelers are encouraged to prepare program codes of their models in such a way as to output a numerical table containing forecast numbers of events in the format according to the template "ForecastML". Please see the section "GridML and ForecastML template".
Please note that the GridML and ForecastML template prepared here are used for conducting test runs. These might be subject to change.
To be determined. To conduct test runs, modelers are encouraged to consider the revised JMA bulletin without applying declustering process.
Most of forecast models require data sources such as earthquake catalogs for model development and optimization. If the JMA earthquake data are needed for such purpose, please contact at ZISINyosoku-submit@eri.u-tokyo.ac.jp. We can provide modelers with the JMA catalog in the original format and the ZMAP/CSEP ASCII format. The latter format is represented by 13 columns as follows: 1. Longitude [°]; 2. Latitude [°]; 3. Decimal year (e.g., 2005.5 for July 1st, 2005); 4. Month; 5. Day; 6. Magnitude; 7. Depth [km]; 8. Hour; 9. Minute; 10. Second; 11. Horizontal error; 12. Depth error; and 13. Magnitude error.
For more information, please contact at